A $550,000 Brickell condo appreciated 12.4% over two years, while a $476,000 Little Haiti townhouse delivered a 67% return over five. The critical divergence in these outcomes is exactly what generic real estate advice fails to explain.
The best Miami neighborhoods in 2026 are not found through anecdotal preference; they emerge from quantifiable data.
Metrics are the true differentiator:
-
School ratings above 8/10 can add $200,000+ to median prices.
-
High Walk Scores command significant premiums.
-
Proximity to key employment centers maintains higher appreciation velocity.
This guide deconstructs Miami's complex neighborhood matrix through ROI projections, cost-per-square-foot analysis, and school performance data, ensuring buyers can match their specific financial profile and lifestyle requirements to the areas that deliver optimal returns.
Core Pillars of This Research
-
Quantitative Investment Metrics: Deconstructing price per square foot, annualized appreciation rates, rental yields, and the true cost of ownership across 20+ key Miami neighborhoods.
-
Education and Value Premium: Data-driven analysis of school performance (GreatSchools ratings and college placement) to quantify the $150K–$300K price premium paid for A-rated school districts.
-
The Commute Reality Index: Accurate rush-hour drive times to major employment centers, providing actual mobility costs rather than optimistic, off-peak estimates.
-
Investment-Grade ROI Projections: Strategic forecasting to match specific investor profiles (appreciation-first vs. cash flow priority) with the neighborhoods offering the highest risk-adjusted returns.
-
Hidden Cost Mitigation: A transparent breakdown of financial variables—including escalating HOA fees, coastal insurance premiums, and property tax nuances—that dramatically alter total affordability.
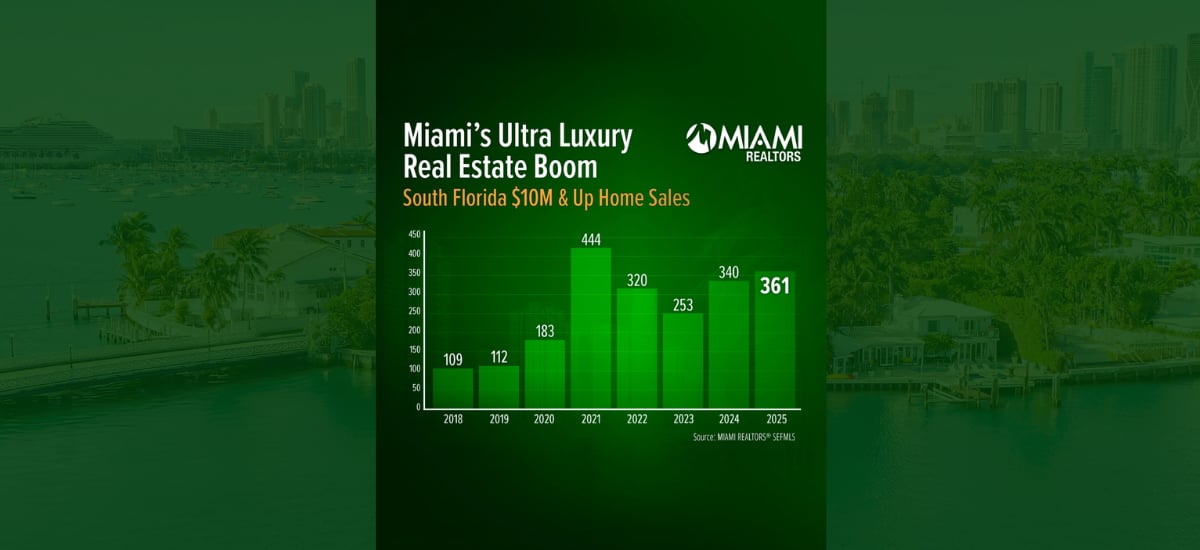
Miami's real estate market operates on unique fundamentals that contradict national trends. While many metros saw cooling demand in 2024, Miami-Dade County single-family median prices climbed to $675,000—a 10.7% year-over-year increase driven by sustained migration and limited inventory.
-
Migration Patterns: The region's appeal to international and out-of-state buyers is profound: Miami-Fort Lauderdale-West Palm Beach is the #1 destination for international buyers in Florida, creating persistent demand pressure. New York, California, and Illinois transplants bring higher income expectations and tolerance for premium pricing, pushing median prices upward even as mortgage rates hover near 7%.
-
Appreciation Velocity: While city-specific data is proprietary, Miami-Dade County's broader price appreciation is nearly 2x the national figure. Furthermore, emerging areas like Little Haiti have demonstrated massive growth velocity, with median listing prices trending up 14.7% year-over-year (as of Q3 2025), reflecting the market's high-risk, high-reward opportunities.
-
Investor Activity: Miami is globally recognized for its strong investment fundamentals. The city is ranked the #1 most competitive rental market in the U.S., with a high occupancy rate that drives strong gross yields for investors.
Miami Market Intelligence
|
Market Metric |
Current Data |
What It Means for Buyers |
|
Median Home Price |
Single-Family Median Price: $682,000 (+1.7% YoY, Oct 2025) |
Expect sustained high price levels and inventory constraints through 2026. |
|
Out-of-State Buyers |
Ranks #1 Globally for Cross-Border Investment Volume |
Competition is driven by buyers with significant capital and stronger purchasing power. |
|
Top Growth Neighborhood |
Localized high-growth trends exceed +14.7% YoY listing price growth |
Early-stage gentrification offers high ROI, but requires accepting greater risk. |
|
Rental Market Competition |
Strong cash flow prospects attract institutional capital, further constraining inventory. |
The strategic insight: Miami's market rewards both momentum plays (emerging neighborhoods with strong annual gains) and stability plays (established areas with predictable, above-national appreciation). Your financial profile determines which strategy fits.
Access live Miami market data and property listings
What Are the Best Neighborhoods in Miami for Families Looking to Buy a Home?
Family buyers optimize for three non-negotiable variables: school quality (driving long-term property values), safety (enabling children's independence), and community infrastructure (parks, youth programs, family density). Price becomes secondary when these fundamentals align.
The School Quality Premium: What Families Actually Pay
Miami-Dade's school quality varies more dramatically than any other Florida metro. An A-rated school versus B-rated school in adjacent neighborhoods creates $150,000-$300,000 median price differentials for identical housing stock.
|
Neighborhood |
GreatSchools Rating |
Top School |
Home Price Premium |
Median Price |
|
Coral Gables |
9/10 |
Coral Gables Senior High |
+$450K over county avg. |
$1.2M |
|
Pinecrest |
9/10 |
Palmetto High School |
+$350K over county avg. |
$1.1M |
|
Coconut Grove |
8/10 |
Coconut Grove Elementary |
+$600K over county avg. |
$1.5M |
|
Key Biscayne |
8/10 |
MAST Academy |
+$1.1M over county avg. |
$2.1M |
Coral Gables: The Family Default
Every real estate conversation about Miami families eventually arrives at Coral Gables. The reasons prove quantifiable: Coral Gables Senior High ranks in Florida's top 50 public schools (9/10 GreatSchools rating), violent crime runs 45% below county averages, and homes sit on 7,000-10,000 sq ft lots—rare in urban Miami.
The trade-off math: $1.2 million median buys 3-4 bedrooms with Mediterranean Revival architecture and 15-minute access to Brickell employment centers. Alternative private school costs ($25,000-$35,000 annually per child) would total $450,000+ over K-12 for two children, making the Gables' public school premium financially rational for families planning decade-long residency.
Commute reality: 15 minutes to Brickell/downtown during off-peak, 25-30 minutes during rush hour via US-1 or Metrorail.
Pinecrest: Suburban Space Premium
Pinecrest delivers what Coral Gables doesn't: true suburban lot sizes averaging 1+ acres. Families trade walkability and urban proximity for pools, outdoor space, and parking that accommodates teenage drivers.
The value equation: $1.1 million median provides $100,000 discount versus Coral Gables while maintaining A-rated schools (Palmetto High: 9/10). The 30-40 minute downtown commute represents the primary sacrifice, requiring families to accept car dependency and longer parent work hours.
School performance: 92% graduation rate, extensive AP offerings, strong athletic programs that matter to suburban families.
Coconut Grove: Character Over Formula
The Grove attracts families willing to pay premium pricing ($1.5 million median) for neighborhood character absent in planned communities. Ransom Everglades School (among Florida's top 5 private institutions) anchors the area, though tuition adds $40,000+ annually to family budgets.
The lifestyle premium: Walk Score of 72 enables car-free errands. Biscayne Bay access, sailing clubs, and Peacock Park create outdoor programming. The bohemian atmosphere attracts creative professionals and academics seeking community over uniformity.
Price variation: Waterfront estates ($3-10 million+) versus inland homes ($800,000-$1.5 million) create unusual economic diversity within single neighborhood.
Key Biscayne: Island Security Premium
The barrier island's single causeway access creates natural security that no gated community replicates. Families pay $2.1 million median for this geography-enabled safety plus MAST Academy's STEM-focused curriculum.
The isolation trade-off: Every mainland trip requires causeway transit, creating 15-minute minimums for all errands. Families accept this inconvenience for near-zero violent crime, extensive parks, and resort-style tennis/cycling infrastructure.
Insurance reality: Coastal properties require wind and flood coverage totaling $8,000-$15,000 annually—a hidden cost that affects total ownership calculations.
Private School Strategy: When Premium Neighborhoods Don't Deliver
|
Neighborhood |
Top Private School |
Annual Tuition |
12-Year Cost (2 Kids) |
Public School Alternative |
|
Coral Gables |
Gulliver Prep |
$32,000 |
$768,000 |
Excellent (9/10) |
|
Coconut Grove |
Ransom Everglades |
$42,000 |
$1,008,000 |
Good (8/10) |
|
Pinecrest |
Palmer Trinity |
$30,000 |
$720,000 |
Excellent (9/10) |
|
Brickell |
Archimedean Academy |
$18,000 |
$432,000 |
Mixed (6-8/10) |
Strategic insight: Coral Gables and Pinecrest offer sufficient public school quality that private school becomes optional rather than mandatory. Brickell's weaker public schools push most families toward private education, negating the neighborhood's urban lifestyle advantages for school-age children.
Explore family-focused properties in top school districts
What Are the Safest and Most Desirable Neighborhoods to Purchase a Home in Miami?
Safety metrics matter differently across buyer segments. Families prioritize violent crime statistics and school security. Young professionals accept higher property crime (car break-ins) for walkable urban living. Retirees optimize for comprehensive security infrastructure including building access and emergency medical response.
Crime Data Analysis: Beyond Perception to Statistics
|
Neighborhood |
Violent Crime Index* |
Property Crime Index* |
Security Infrastructure |
Insurance Impact |
|
Key Biscayne |
18 (-82% vs. Miami) |
45 (-60% vs. Miami) |
Island access control |
Moderate (coastal) |
|
Coral Gables |
35 (-65% vs. Miami) |
68 (-40% vs. Miami) |
Dedicated police force |
Low (inland) |
|
Aventura |
42 (-58% vs. Miami) |
72 (-36% vs. Miami) |
Tower security systems |
Moderate (coastal) |
|
Coconut Grove |
48 (-52% vs. Miami) |
85 (-25% vs. Miami) |
Neighborhood watch |
Low (inland) |
|
Brickell |
55 (-45% vs. Miami) |
92 (-18% vs. Miami) |
Building concierge 24/7 |
Low (high-rise) |
*Index: 100 = Miami-Dade County average. Lower numbers indicate less crime.
The Island Security Model: Key Biscayne
Geography creates security no amount of police patrols replicate. The single causeway access point enables the 13,000-person community to maintain near-perfect visibility of entry/exit patterns. Violent crime index of 18 (82% below county average) reflects this structural advantage.
The psychology of island living: parents allow children significantly more independence than equivalent-income families in urban Miami. Middle schoolers bike to village center, high schoolers drive golf carts, and community density creates natural supervision.
Trade-off: causeway creates both security and potential evacuation bottleneck during hurricanes. Hurricane preparedness becomes mandatory annual ritual.
The Police Force Model: Coral Gables
Coral Gables' dedicated municipal police force (separate from Miami-Dade Police) enables response time and community familiarity impossible in larger jurisdictions. The city's architectural review board and strict code enforcement create visual order that correlates with actual safety.
Quantified safety: violent crime index of 35 represents 65% reduction versus county average. Property crime remains higher than Key Biscayne due to retail density and daytime population influx.
Economic factor: property values benefit from safety perception, creating self-reinforcing cycle where affluent buyers cluster, funding better city services.
The Gated Tower Model: Aventura
High-rise security combines 24/7 concierge, controlled elevator access, parking garage gates, and lobby cameras. Aventura's concentration of residential towers creates neighborhood-wide security infrastructure.
The demographic contribution: older, affluent population (median age 48) exhibits lower crime propensity. The city's walkability around Aventura Mall reduces car dependency that often correlates with property crime.
Insurance benefit: newer construction and building security systems reduce homeowners insurance premiums 15-25% versus older single-family homes in comparable locations.
Walk Score vs. Safety: The Urban Trade-off
|
Neighborhood |
Walk Score |
Safety Rating |
What You're Trading |
|
Brickell |
95 |
Moderate |
High walkability, accept urban property crime |
|
Coconut Grove |
72 |
High |
Balanced—walkable village with residential safety |
|
Coral Gables |
58 |
Very High |
Limited walkability, maximum safety |
|
Pinecrest |
32 |
Very High |
Full car dependency, suburban security |
Strategic framework: buyers can't optimize for maximum walkability AND maximum safety in Miami. Brickell offers best walkability but highest property crime among upscale neighborhoods. Pinecrest delivers lowest crime but requires driving for every errand.
The exception: Coconut Grove achieves unusual balance through village center walkability (grocery, dining, services) combined with residential street tranquility.
Schedule neighborhood tours to experience safety and walkability firsthand
Best Neighborhoods in Miami for Young Professionals
Young professional buyers optimize for different variables than families: commute minimization to major employment centers, social density for networking and dating, and walkability that eliminates car ownership costs. School quality becomes irrelevant; urban lifestyle takes priority.
The Commute-Cost-Lifestyle Matrix
|
Neighborhood |
Avg. Condo Price |
Commute to Brickell |
Walk Score |
Monthly Costs* |
Lifestyle ROI |
|
Brickell |
$550K |
0 min (live/work) |
95 |
$4,650 |
Maximum—eliminate commute |
|
Edgewater |
$420K |
8 min |
85 |
$3,580 |
High—waterfront + proximity |
|
Wynwood |
$480K |
12 min |
78 |
$3,720 |
High—arts scene + value |
|
Design District |
$600K |
15 min |
82 |
$4,980 |
Premium—luxury positioning |
|
South Beach |
$550K |
25 min |
90 |
$4,720 |
Beach lifestyle + nightlife |
*Includes mortgage (20% down, 7% rate), HOA, property tax, insurance, parking
Brickell: The Financial District Premium
The quantitative argument for Brickell proves straightforward: eliminate 10-hour weekly commutes (50 hours monthly) by living within walking distance of employment. For professionals earning $150,000-$300,000 annually, those 50 hours represent $3,600-$7,200 in opportunity cost monthly.
The lifestyle math: $550,000 condo with $4,650 monthly carrying costs versus $420,000 Edgewater condo with $3,580 monthly costs plus $400 parking and $200 gas. The $470 monthly Brickell premium buys commute elimination, not just housing.
Social infrastructure: density creates serendipitous networking. Rooftop pools, lobby interactions, and street-level dining facilitate professional connections impossible in car-dependent suburbs.
Real estate performance: 12.4% appreciation over 24 months (41% over five years) provides validation that premium pricing reflects genuine demand fundamentals.
Edgewater: The Value-Proximity Play
Edgewater delivers 80% of Brickell's lifestyle at 76% of the cost. The neighborhood's waterfront position along Biscayne Bay, new construction inventory, and 8-minute proximity to Brickell create compelling value proposition.
The trade-off clarity: slightly less walkable dining/nightlife, quieter atmosphere (which some professionals prefer), and 15-20% lower HOA fees due to fewer amenities than Brickell's resort-style buildings.
Appreciation trajectory: 52% over five years suggests Edgewater remains undervalued relative to Brickell, though growth may moderate as development boom concludes.
Wynwood: The Creative Professional Alternative
Wynwood attracts designers, marketers, artists, and entrepreneurs seeking character over polish. The neighborhood's 48% five-year appreciation validates that "creative class" migration creates genuine property value, not just aesthetic preference.
The financial analysis: $480,000 entry point ($70,000 below Brickell) combined with 48% appreciation versus Brickell's 41% suggests risk-adjusted returns favor Wynwood for buyers with 5+ year horizons.
Lifestyle differences: brewery scene and gallery openings versus Brickell's rooftop bars and expense-account dining. Demographics skew slightly older (25-45 versus 23-38 in Brickell) and more entrepreneurial.
The Rent vs. Buy Calculation for Professionals
|
Scenario |
Monthly Rent |
Buy Equivalent |
Monthly Cost |
5-Year Equity Build |
Break-Even |
|
Brickell 1BR |
$3,200 |
$550K condo |
$4,650 |
$48,000 principal + appreciation |
36 months |
|
Edgewater 1BR |
$2,500 |
$420K condo |
$3,580 |
$39,000 principal + appreciation |
32 months |
|
Wynwood 1BR |
$2,800 |
$480K condo |
$3,720 |
$42,000 principal + appreciation |
34 months |
Break-even analysis: professionals planning 3+ year Miami tenure benefit financially from purchasing versus renting, assuming 7% mortgage rates and historical appreciation continues. The $1,000-$1,500 monthly premium for buying accumulates through principal paydown and appreciation exposure.
The career flexibility trade-off: renters maintain mobility for job changes or relocations. Buyers commit to Miami market but build equity that renters forfeit.
Compare urban neighborhoods perfect for your professional lifestyle
Which Miami Neighborhoods Offer the Highest Property Value Appreciation for Home Buyers?
Appreciation rates separate neighborhoods that merely house residents from those that actively build wealth. Understanding which areas deliver highest returns—and why—enables strategic positioning for different investor time horizons.
Five-Year Appreciation Leaders: 2019-2024 Performance
|
Neighborhood |
2019 Median |
2024 Median |
Absolute Gain |
Percentage Gain |
Annualized Return |
|---|---|---|---|---|---|
|
Little Haiti |
$285K |
$476K |
+$191K |
+67% |
+10.8% |
|
Allapattah |
$310K |
$490K |
+$180K |
+58% |
+9.6% |
|
Edgewater |
$380K |
$578K |
+$198K |
+52% |
+8.7% |
|
Wynwood |
$395K |
$585K |
+$190K |
+48% |
+8.1% |
|
Brickell |
$425K |
$599K |
+$174K |
+41% |
+7.1% |
|
Coconut Grove |
$950K |
$1.5M |
+$550K |
+58% |
+9.6% |
|
Coral Gables |
$750K |
$1.2M |
+$450K |
+60% |
+9.8% |
The Emerging Neighborhood Thesis: Little Haiti
Little Haiti's 67% five-year appreciation represents Miami's strongest returns, validating early-stage gentrification investment strategy. The neighborhood benefits from proximity to established areas (Wynwood, Design District, Downtown) while maintaining 40-50% price discounts versus those comparables.
The catalysts: Magic City Innovation District brings tech employment and infrastructure investment. Caribbean cultural heritage creates authentic character that attracts artists and creative businesses. Limited buildable land in core Miami pushes development outward into neighborhoods like Little Haiti with available industrial parcels.
Risk factors: gentrification creates social tension and displacement concerns. Retail infrastructure remains developing. Street conditions and building quality lag established neighborhoods. Early-stage investors accept these trade-offs for appreciation potential.
Investment profile: Little Haiti suits buyers with 7-10 year time horizons, renovation skills or willingness to hire contractors, and tolerance for neighborhood transition uncertainty.
The Established Value Play: Edgewater
Edgewater's 52% five-year appreciation combined with waterfront position and urban proximity creates compelling middle-ground between emerging neighborhoods' high returns and established areas' stability.
The value equation: new construction delivered significant inventory 2018-2023, temporarily moderating prices. As construction boom concludes and inventory absorbs, appreciation may accelerate. The neighborhood's fundamentals—Biscayne Bay waterfront, 8-minute Brickell proximity, improving retail—support continued strength.
Risk assessment: lower than Little Haiti (established neighborhood with infrastructure), higher than Brickell (newer inventory could pressure appreciation if economic downturn reduces demand).
The Stability Premium: Brickell
Brickell's "lower" 41% five-year appreciation actually outperforms most U.S. markets by substantial margins. The neighborhood demonstrates that established areas with strong fundamentals deliver consistent returns without emerging neighborhood volatility.
The stability thesis: financial district employment creates perpetual rental demand. International buyers provide demand floor that insulates from domestic economic cycles. Limited new construction (most buildable land developed) constrains supply growth.
Investor profile: Brickell suits buyers seeking predictable cash flow (5.8% gross rental yields) with moderate appreciation rather than maximum returns. Works for risk-averse investors or those needing immediate rental income.
What Are the Most Up-and-Coming Neighborhoods in Miami?
"Up-and-coming" translates to "high risk, high return." These neighborhoods offer appreciation potential exceeding 50% over five years but require accepting uncertainty, construction disruption, and social transition.
|
Emerging Area |
Current Median |
2-Year Projection |
Key Catalysts |
Risk Level |
|
Little River |
$425K |
$525K (+24%) |
Proximity to Little Haiti, artist migration |
High |
|
Allapattah |
$490K |
$590K (+20%) |
Brightline station, Wynwood spillover |
Moderate-High |
|
West Flagler |
$380K |
$450K (+18%) |
Affordability, transit improvements |
Moderate |
|
MiMo District |
$440K |
$530K (+20%) |
Historic preservation, Biscayne corridor |
Moderate |
Little River: The Next Wynwood Thesis
Little River follows Wynwood's gentrification playbook: industrial buildings converting to creative use, artists priced out of established neighborhoods migrating north, and Miami River waterfront offering development potential.
The timing question: is Little River 2015 Wynwood (early stage, maximum upside) or 2020 Wynwood (transition mostly complete, moderate upside remaining)? Current data suggests early-to-middle stage, implying 5-7 years before full establishment.
Entry strategy: target properties near Little Haiti border and Miami River waterfront. Avoid western sections farther from catalysts.
Allapattah: The Infrastructure Play
Brightline train station's 2024 opening creates transit-oriented development catalyst. The neighborhood's position between Wynwood and Miami International Airport provides geographic advantage.
The appreciation path: commercial-to-residential conversions, improved retail infrastructure, and spillover from Wynwood buyers unable to afford that market's pricing create demand fundamentals.
Caution: large-scale development takes years to mature. Patient investors benefit; those needing near-term appreciation may face frustration.
Identify investment-grade properties in emerging Miami neighborhoods
Where Should I Invest in Real Estate in Miami for Long-Term Returns?
Investment strategy requires defining objective: maximum appreciation, consistent cash flow, or balanced approach. Different neighborhoods optimize for different goals.
Investment Strategy by Profile
|
Investor Type |
Best Neighborhoods |
Expected Returns |
Time Horizon |
Capital Required |
|
Maximum Appreciation |
Little Haiti, Allapattah |
50-70% over 5-7 years |
7-10 years |
30-40% down + renovation |
|
Cash Flow Priority |
Brickell, Wynwood |
5-6% yield + 7% appreciation |
3-5 years |
20-25% down |
|
Balanced Growth |
Edgewater, Coconut Grove |
8-12% annual total return |
5-7 years |
20-30% down |
|
Luxury Positioning |
Miami Beach estates |
5-8% annual + prestige |
10+ years |
30-50% down |
The Appreciation-First Strategy: Little Haiti and Allapattah suit buyers who can carry negative cash flow for 2-3 years during renovation, accept 20-30% vacancy rates during transition, and have renovation expertise.
The Cash Flow Strategy: Brickell and Wynwood deliver immediate rental income with professional tenant pools. Lower maintenance and reliable rent payment characterize both markets.
The Balanced Approach: Edgewater combines 4.5-5% yield with 8-12% annual appreciation. Lower risk than emerging neighborhoods but better returns than pure cash flow plays.
Rental Regulations Impact
Miami's Airbnb regulations significantly affect investment strategy. Most residential buildings prohibit short-term rentals under 6 months.
|
Zone Type |
Short-Term Status |
Strategy Impact |
|
Residential buildings |
Prohibited (<6 months) |
Long-term rental only |
|
Hotel-zoned properties |
Allowed with permit |
Short-term premium possible |
|
Single-family homes |
Municipality-dependent |
Verify specific regulations |
Don't underwrite investments assuming Airbnb income unless property explicitly permits short-term rentals and you've verified current regulations.
Best Areas in Miami for Retirees
Retiree buyers optimize for healthcare proximity, walkability (reducing driving as aging progresses), safety, and maintenance-free living. Price becomes secondary to these lifestyle fundamentals.
|
Retirement Destination |
Median Price |
Healthcare Access |
Walkability |
Maintenance Level |
|
Key Biscayne |
$2.1M |
15 min to Mt. Sinai |
Moderate |
Low (single-family) or None (condos) |
|
Aventura |
$580K |
On-site (Aventura Hospital) |
High (mall access) |
None (condo towers) |
|
Coral Gables |
$1.2M |
20 min to UM Hospital |
Moderate (downtown) |
Low (single-family) |
|
Surfside |
$950K |
10 min to Mt. Sinai |
High (beach town) |
None (condos) |
Key Biscayne: Active Retirement Haven
The island suits active retirees (60s-70s) prioritizing outdoor lifestyle over urban density. Tennis facilities, bike paths, and beach access enable exercise-focused retirement. The community's 13,000 population creates genuine neighborliness impossible in high-rise developments.
Healthcare consideration: Mount Sinai Medical Center sits 15 minutes away via causeway. For retirees with chronic conditions requiring frequent specialist visits, this distance matters more than those in good health.
The social reality: Key Biscayne skews toward families and younger retirees. Those seeking age-segregated communities (where most neighbors are retirees) may prefer Aventura.
Aventura: The Medical Access Premium
Aventura Hospital's on-site presence provides unmatched healthcare security for retirees. The combination of immediate emergency care, specialty practices, and routine care creates comprehensive medical infrastructure.
Walkability advantage: Aventura Mall access enables car-free living. Groceries, dining, entertainment, and medical services all exist within walking distance or short shuttle rides many buildings provide.
Demographics: median age 48 ensures peer group. Many buildings feature 55+ residents concentrated on certain floors, creating natural social cohesion.
Coral Gables: Cultural Retirement
The Gables attracts intellectually curious retirees seeking cultural programming, sophisticated dining, and architectural beauty. University of Miami provides lifelong learning opportunities, lectures, and cultural events.
The trade-off: single-family home maintenance versus condo living. Many retirees choose Coral Gables condos or townhomes combining the city's character with reduced maintenance burden.
Cost consideration: $1.2 million median exceeds other retiree-focused neighborhoods, reflecting the Gables' premium positioning.
Surfside: Beach Town Simplicity
This small town between Bal Harbour and Miami Beach offers quiet coastal living with easy urban access. The community's Mediterranean-style buildings, beach access, and small-town atmosphere appeal to retirees seeking simplicity.
Hurricane concern: beachfront location requires comprehensive insurance and hurricane preparedness. Some retirees prefer this trade-off for beach proximity; others find the annual storm season anxiety unacceptable.
Best Neighborhoods in Miami for First-Time Buyers
First-time buyers face the starkest trade-offs: affordability versus commute time, price versus appreciation potential, and current lifestyle versus future family needs.
|
Entry-Level Neighborhood |
Median Price |
Down Payment (10%) |
Monthly Payment* |
Commute to Brickell |
Appreciation (5yr) |
|
Hialeah |
$420K |
$42K |
$3,250 |
35-45 min |
+35% |
|
Kendall |
$480K |
$48K |
$3,680 |
30-40 min |
+38% |
|
Doral |
$520K |
$52K |
$3,950 |
25-35 min |
+42% |
|
North Miami |
$450K |
$45K |
$3,450 |
25-30 min |
+40% |
*Assumes 10% down, 7% interest, includes taxes, insurance, HOA
Hialeah: Maximum Affordability
Hialeah offers lowest entry point ($420K median) for single-family homes with yards—increasingly rare in urban Miami. The city's working-class Hispanic character creates tight-knit communities with authentic culture.
The commute reality: 35-45 minutes to Brickell represents 350-450 hours annually—equivalent to 9-11 work weeks. First-time buyers must honestly assess whether this time sacrifice fits their career stage and family plans.
Financial logic: the $130K savings versus Kendall ($480K) compounds over 30-year mortgage to $87,000 in interest savings. For buyers maximizing every dollar, Hialeah's pricing enables homeownership otherwise impossible.
Kendall: Suburban Practicality
Kendall splits the difference between affordability and convenience. The area's sprawling development, chain retail, and car-dependent layout lack character but provide practical housing at accessible prices.
The family planning consideration: decent schools and family-oriented communities make Kendall strategic for first-time buyers planning children within 3-5 years. The neighborhood accommodates growing families better than urban condos.
Appreciation: 38% over five years validates that suburban areas participate in Miami's growth despite lacking urban glamour.
Doral: New Construction Premium
Doral's master-planned communities and newer housing stock command $40,000 premium over Kendall ($520K versus $480K). Buyers pay for modern amenities, HOA-managed maintenance, and proximity to Miami International Airport.
Employment consideration: Doral hosts numerous corporate offices (particularly Latin American headquarters). Professionals working in western Miami-Dade save 20-30 minutes daily versus those commuting from eastern neighborhoods.
Trade-off: slightly longer commute to Brickell (25-35 minutes) but better proximity to airport and western employment centers.
North Miami: Urban Proximity Play
North Miami's positioning between downtown Miami and Fort Lauderdale provides better urban access than southwestern suburbs at comparable pricing. The area's diversity and improving retail infrastructure appeal to younger buyers.
The value thesis: $450K entry point combined with 40% five-year appreciation suggests North Miami remains undervalued relative to established neighborhoods. Early buyers may capture appreciation as area continues developing.
Calculate your purchasing power across Miami neighborhoods
How Do Miami Neighborhoods Compare in Total Cost of Living?
Purchase price represents only 40-60% of true ownership costs. Understanding HOA fees, property taxes, insurance premiums, and utilities reveals total financial commitment.
Total Monthly Ownership Cost Analysis
|
Neighborhood |
Purchase Price |
Mortgage* |
HOA |
Property Tax |
Insurance |
Utilities |
Total Monthly |
|
Brickell (Condo) |
$550K |
$3,600 |
$800 |
$470 |
$280 |
$200 |
$5,350 |
|
Coral Gables (SFH) |
$1.2M |
$7,850 |
$200 |
$980 |
$685 |
$350 |
$10,065 |
|
Kendall (SFH) |
$480K |
$3,140 |
$350 |
$420 |
$315 |
$300 |
$4,525 |
|
Key Biscayne (Condo) |
$2.1M |
$13,750 |
$1,200 |
$1,660 |
$1,250 |
$250 |
$18,110 |
|
Edgewater (Condo) |
$420K |
$2,750 |
$600 |
$360 |
$260 |
$180 |
$4,150 |
*Assumes 20% down, 7% interest rate
The HOA Fee Reality
Brickell condos charge $600-$1,200 monthly, covering building maintenance, amenities, master insurance, and reserves. These fees never disappear—they persist throughout ownership and typically increase 3-5% annually.
The 30-year impact: $800 monthly HOA fee with 4% annual increases totals $554,000 over 30-year mortgage period—exceeding the down payment on a $550,000 condo.
Single-family home advantage: Coral Gables and Pinecrest charge minimal HOAs ($200-$400 monthly) for common area maintenance. Owners control maintenance timing and costs rather than paying fixed monthly fees.
Insurance Cost Shocks
Florida homeowners insurance costs 2-3x national averages. Coastal properties require separate wind and flood policies creating combined bills of $8,000-$15,000 annually for single-family homes.
Condo advantage: building master policies cover exterior and structural elements. Individual unit policies cost $2,500-$4,000 annually—substantially less than single-family equivalents.
The risk: condo associations facing major repairs (roof replacement, structural issues) levy special assessments ranging from $10,000-$50,000+ per unit. This risk doesn't exist with single-family homes where owners control maintenance timing.
Property Tax Nuances
Miami-Dade County's property tax rate averages 1.02%, but municipalities vary. Coral Gables maintains slightly lower effective rates (0.98%) through efficient city services. Hialeah runs higher (1.08%) due to less affluent tax base requiring higher rates for equivalent services.
Homestead Exemption: up to $50,000 assessed value reduction applies only to primary residences. Investors and second-home owners pay full property taxes without exemption.
Save Our Homes: caps annual assessment increases at 3% or CPI for homesteaded properties. This protection prevents assessment spikes during rapid appreciation but doesn't apply to new buyers until they establish homestead.
Schedule a consultation to calculate neighborhood-specific ownership costs
Strategic Neighborhood Selection Framework
Miami's 40+ neighborhoods require matching your specific situation against quantifiable criteria rather than following generic advice.
-
Career-Focused Professionals (25-40): Prioritize commute time and networking density. Optimal: Brickell, Edgewater, Wynwood. Accept higher costs and smaller spaces for career advancement opportunities.
-
Growing Families (30-45): Prioritize school quality (8+ rating) and safety. Optimal: Coral Gables, Pinecrest, Coconut Grove. Accept higher prices and longer commutes for educational outcomes.
-
Aggressive Investors: Prioritize appreciation potential over cash flow. Optimal: Little Haiti, Allapattah, Little River. Accept renovation requirements and extended hold periods for 50-70% returns.
-
Income-Focused Investors: Prioritize rental yield and tenant quality. Optimal: Brickell, Wynwood, Edgewater. Accept moderate appreciation for immediate positive cash flow.
-
Retirees (60+): Prioritize healthcare access and walkability. Optimal: Aventura, Key Biscayne, Surfside. Accept higher costs for maintenance-free living.
-
First-Time Buyers (25-35): Prioritize affordability and appreciation potential. Optimal: Kendall, Doral, North Miami. Accept longer commutes for homeownership entry.
Beyond the Listing: Working with Data-Driven Neighborhood Specialists
Typical real estate advice fails in Miami's heterogeneous market. The factors driving a Brickell condo's valuation differ entirely from the appreciation catalysts in Little Haiti. Effective representation requires moving beyond general market knowledge and embracing neighborhood-specific quantitative expertise.
The Joelle Oiknine Group specializes in the quantitative analysis most agents overlook. We provide the hard, financial facts necessary for strategic purchasing:
-
Commute Reality Testing: Actual rush-hour drive times to major employment centers—not Google's optimistic estimates.
-
Cost Reality Analysis: Comparative HOA fee analysis across similar buildings, precise property tax projections based on recent assessment patterns, and the true insurance cost reality for specific flood zones and building ages.
-
Structural Due Diligence: Insight into which buildings maintain competent condo associations versus those with a history of deferred maintenance or potential special assessments.
Our process begins with understanding your unique financial position, family structure, and career stage. We match these specific requirements to neighborhoods that offer the optimal combination of current livability and verifiable future appreciation, ensuring your move is an informed investment, not a lifestyle gamble.
Review our methodology for data-driven neighborhood matching
Watch detailed neighborhood analysis walkthroughs
Examine specific transactions and client outcomes
Read our published market analysis and forecasts
Frequently Asked Questions
What are the safest neighborhoods in Miami?
Key Biscayne shows the lowest violent crime rate (82% below county average), followed by Coral Gables (65% below) and Aventura (58% below) based on FBI crime data.
Which Miami neighborhoods are best for families?
Coral Gables, Pinecrest, and Coconut Grove offer the highest-rated schools (8-9/10 GreatSchools ratings), lowest crime, and best family infrastructure.
What is the most affordable area to live in Miami?
Hialeah offers the lowest median price at $420,000, followed by North Miami at $450,000 for buyers prioritizing affordability over location.
Where do young professionals live in Miami?
Brickell (95 Walk Score, 0-minute commute) attracts the highest concentration, followed by Edgewater and Wynwood for professionals prioritizing urban lifestyle.
What neighborhoods in Miami have the best schools?
Coral Gables Senior High and Palmetto High School (both 9/10 ratings) lead public schools, while Ransom Everglades tops private institutions.
What is the best area to buy property in Miami?
Little Haiti offers highest appreciation potential (67% over 5 years), Brickell provides best cash flow (5.8% yield), and Coral Gables delivers stability for families.
Which Miami neighborhoods are walkable and safe?
Brickell achieves the highest Walk Score (95) with adequate safety, while Coconut Grove balances walkability (72) with lower crime rates.
What are the most up-and-coming neighborhoods in Miami?
Little Haiti leads with 67% five-year appreciation, followed by Allapattah (58%) and Little River showing early gentrification indicators.
Is Brickell or Wynwood better for renting?
Brickell delivers higher rental yields (5.8% vs 5.2%) with corporate tenants, while Wynwood offers stronger appreciation (48% vs 41% over five years).
How do Miami neighborhoods compare in cost of living?
Total monthly costs range from $4,150 in Edgewater to $18,110 in Key Biscayne when including mortgage, HOA, taxes, insurance, and utilities.